Showing 1–16 of 506 resultsSorted by latest
Showing 1–16 of 506 resultsSorted by latest


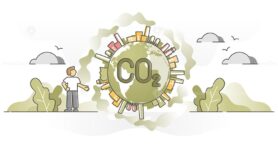 Global emissions as CO2 carbon dioxide smoke around planet outline concept
1 × €4.99
Global emissions as CO2 carbon dioxide smoke around planet outline concept
1 × €4.99  FREE Xylene molecule vector illustration
1 × €0.00
FREE Xylene molecule vector illustration
1 × €0.00 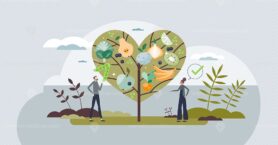 Veganism and vegan diet lifestyle as healthy food choice tiny person concept
1 × €4.99
Veganism and vegan diet lifestyle as healthy food choice tiny person concept
1 × €4.99 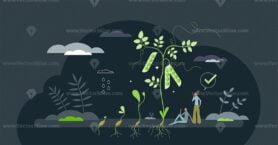 Plant based diets with green fresh natural food eating tiny person concept
1 × €4.99
Plant based diets with green fresh natural food eating tiny person concept
1 × €4.99  Work flow vector illustration
1 × €4.99
Work flow vector illustration
1 × €4.99  FREE Productivity and work performance efficiency development outline concept
1 × €0.00
FREE Productivity and work performance efficiency development outline concept
1 × €0.00  MRP vector illustration
1 × €4.99
MRP vector illustration
1 × €4.99  Circular economy system to eliminating waste of resources outline diagram
1 × €7.99
Circular economy system to eliminating waste of resources outline diagram
1 × €7.99  Silk moth life cycle illustrated vector diagram
1 × €7.99
Silk moth life cycle illustrated vector diagram
1 × €7.99 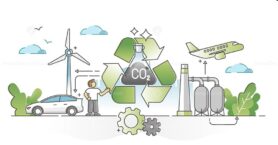 Recycling carbon dioxide and renewable methanol alternative outline concept
1 × €4.99
Recycling carbon dioxide and renewable methanol alternative outline concept
1 × €4.99  Data research, statistic information report scheme monocolor outline concept
1 × €2.99
Data research, statistic information report scheme monocolor outline concept
1 × €2.99  Kaizen vector illustration
1 × €7.99
Kaizen vector illustration
1 × €7.99  FREE Green packaging as paper, glass or plastic wrapping recycling outline concept
1 × €0.00
FREE Green packaging as paper, glass or plastic wrapping recycling outline concept
1 × €0.00  Biofuel life cycle process from biomass growth to consumption outline concept
1 × €4.99
Biofuel life cycle process from biomass growth to consumption outline concept
1 × €4.99  Green packaging as household plastic items recycling tiny person concept
1 × €4.99
Green packaging as household plastic items recycling tiny person concept
1 × €4.99  CO2 emissions as dangerous carbon dioxide air pollution tiny person concept
1 × €4.99
CO2 emissions as dangerous carbon dioxide air pollution tiny person concept
1 × €4.99  Orographic effect shows moist air rising over mountains, causing rain on the windward side and dry air on the leeward. Key objects, mountain, clouds, rain. Outline diagram
1 × €7.99
Orographic effect shows moist air rising over mountains, causing rain on the windward side and dry air on the leeward. Key objects, mountain, clouds, rain. Outline diagram
1 × €7.99  Aquaculture as seafood farming for production cultivation outline concept
1 × €4.99
Aquaculture as seafood farming for production cultivation outline concept
1 × €4.99  FREE KPI or key performance indicator outlined measurement vector illustration
1 × €0.00
FREE KPI or key performance indicator outlined measurement vector illustration
1 × €0.00 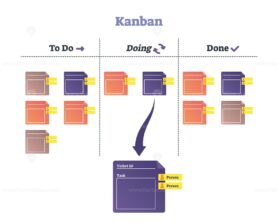 Kanban vector illustration
1 × €7.99
Kanban vector illustration
1 × €7.99 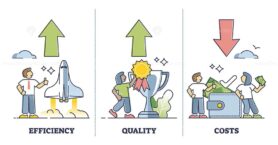 Cost, efficiency and quality as production expenses optimization outline set
1 × €7.99
Cost, efficiency and quality as production expenses optimization outline set
1 × €7.99  Biofuel production from corn as sustainable natural fuel tiny person concept
1 × €4.99
Biofuel production from corn as sustainable natural fuel tiny person concept
1 × €4.99  Clean air act as agreement deal for fresh and pure breathing outline concept
1 × €4.99
Clean air act as agreement deal for fresh and pure breathing outline concept
1 × €4.99  Productivity vector illustration
1 × €4.99
Productivity vector illustration
1 × €4.99  Slow fashion and sustainable, nature friendly clothing tiny person concept
1 × €4.99
Slow fashion and sustainable, nature friendly clothing tiny person concept
1 × €4.99  Growth vector illustration
1 × €4.99
Growth vector illustration
1 × €4.99  Nitrogen cycle vector illustration
1 × €7.99
Nitrogen cycle vector illustration
1 × €7.99  Geothermal energy production as home heating system scheme outline concept
1 × €4.99
Geothermal energy production as home heating system scheme outline concept
1 × €4.99  Sources of clean drinking water as natural eco resource vector illustration
1 × €7.99 Greenhouse effect shows how solar radiation, Earths surface, and greenhouse gases interact to trap heat. Doodle style diagram
1 × €7.99
Sources of clean drinking water as natural eco resource vector illustration
1 × €7.99 Greenhouse effect shows how solar radiation, Earths surface, and greenhouse gases interact to trap heat. Doodle style diagram
1 × €7.99 Subtotal: €154.74
| Cookie | Duration | Description |
|---|---|---|
| cookielawinfo-checkbox-analytics | 11 months | This cookie is set by GDPR Cookie Consent plugin. The cookie is used to store the user consent for the cookies in the category "Analytics". |
| cookielawinfo-checkbox-functional | 11 months | The cookie is set by GDPR cookie consent to record the user consent for the cookies in the category "Functional". |
| cookielawinfo-checkbox-necessary | 11 months | This cookie is set by GDPR Cookie Consent plugin. The cookies is used to store the user consent for the cookies in the category "Necessary". |
| cookielawinfo-checkbox-others | 11 months | This cookie is set by GDPR Cookie Consent plugin. The cookie is used to store the user consent for the cookies in the category "Other. |
| cookielawinfo-checkbox-performance | 11 months | This cookie is set by GDPR Cookie Consent plugin. The cookie is used to store the user consent for the cookies in the category "Performance". |
| viewed_cookie_policy | 11 months | The cookie is set by the GDPR Cookie Consent plugin and is used to store whether or not user has consented to the use of cookies. It does not store any personal data. |