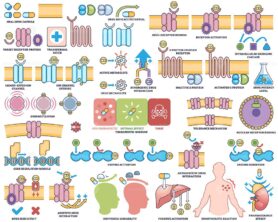
Dose response curve brief shows a sigmoid line, labeled axes, and EC50 marker to illustrate potency, efficacy, and plateau phases in pharmacology. Outline diagram
€9.67 Including Tax
- Buy once, own it forever
- Something wrong? We'll fix it or refund it
This product includes:


PNG
Transparent Background Image File
SVG
Editable Vector File for Web Use
JPG
High-resolution Image File
AI
Adobe Illustrator Source File
EPS
Editable Vector File for Print Use

Meta description: Dose response curve brief shows a sigmoid line, labeled axes, and EC50 marker to illustrate potency, efficacy, and plateau phases in pharmacology. Outline diagram