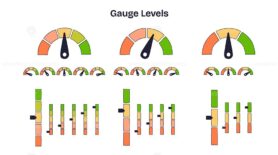
Gauge levels outline visualizes metrics and progress, circular gauges, dotted progress bars, and vertical meters convey data control and UI status. Outline style collection
€4.99
This product includes:
1. Editable Vector .AI file
Compatibility:
Adobe Illustrator CC
2. Editable Vector .EPS-10 file
Compatibility:
Most Vector Editing Software
3. High-resolution JPG image
6000 x 3333 px
License terms in short:
Use for everything except reselling item itself.
Read a full license here
Meta description: Gauge levels outline visualizes metrics and progress, circular gauges, dotted progress bars, and vertical meters convey data control and UI status. Outline style collection




Vaccine mechanism brief diagram shows syringe, antibodies, and memory cells guiding immunity from antigen to rapid response and pathogen neutralization. Outline diagram
Hematopoiesis as blood cellular stem components formation outline diagram
White blood cells diagram shows granulocytes vs agranulocytes, highlighting neutrophil, lymphocyte, and monocyte with functions against pathogens. Outline diagram
B cell activation pathway showing naive B cell, helper T cell, and antibodies, antigen signals drive clonal expansion to memory and plasma cells. Outline diagram
Innate and adaptive immune response visual showing pathogen defense pathways, key elements, macrophage, T cell activation, antibody production. Outline diagram
Innate immunity response diagram showing epithelial barrier breach, macrophage phagocytosis, and dendritic cell signaling to adaptive defense. Outline diagram
Dopamine vector illustration. Labeled diagram with its action and pathways.
Immune response brief flow shows innate to adaptive stages with T cells, B cells, and antibodies defeating pathogens, cells interact over time from exposure to memory. Outline diagram
Immunodeficiency disorders outline showing innate vs adaptive defects, key icons, B-cell, T-cell, phagocyte. Explains roles and causes across categories. Outline diagram