
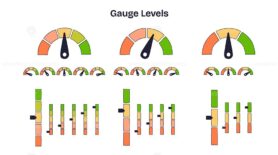
Gauge Levels V2 visuals depict performance tracking via colored meters, needles, and sliders, expressing status from low risk to optimal range. Outline style collection
€4.99
- Buy once, own it forever
- Something wrong? We'll fix it or refund it
This product includes:

1. Editable Vector .AI file
Compatibility:
Adobe Illustrator CC

2. Editable Vector .EPS-10 file
Compatibility:
Most Vector Editing Software

3. High-resolution JPG image
5000 x 3500 px

License terms in short:
Use for everything except reselling item itself.
Read a full license here
Meta description: Gauge Levels V2 visuals depict performance tracking via colored meters, needles, and sliders, expressing status from low risk to optimal range. Outline style collection


