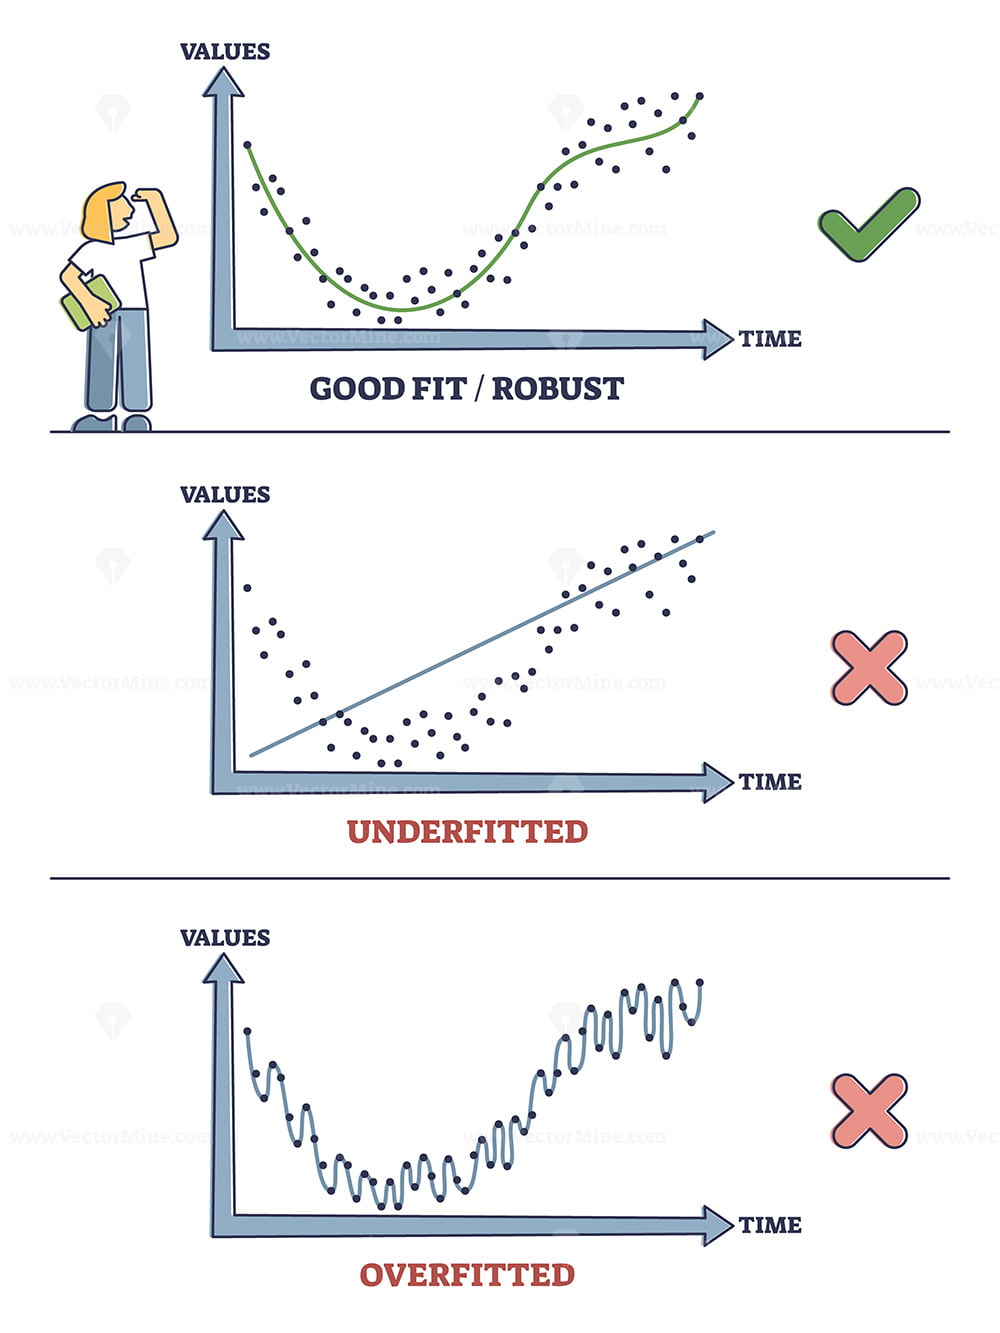
Underfitting, good or robust fit and overfitted statistics outline diagram
€7.99
- Buy once, own it forever
- Something wrong? We'll fix it or refund it
This product includes:

1. Editable Vector .AI file
Compatibility:
Adobe Illustrator CC
Includes Editable Text Font SuezOne (Under Free Open Font License)

2. Editable Vector .EPS-10 file
Compatibility:
Most Vector Editing Software

3. High-resolution JPG image
3750 x 5000 px

License terms in short:
Use for everything except reselling item itself.
Read a full license here
Description: Underfitting, good or robust fit and overfitted statistic results outline diagram. Labeled educational data representation on values and time axis with examples vector illustration. Correct vs wrong.


