
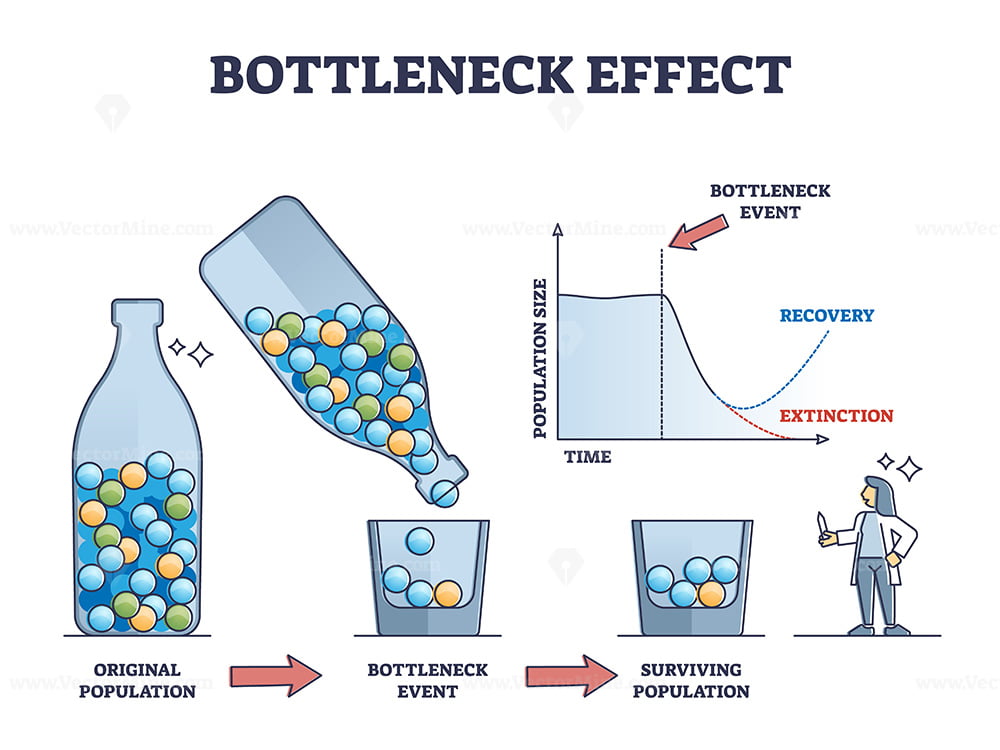

Bottleneck effect axis scheme on genetic drift and population outline diagram
€9.67 Including Tax
- Buy once, own it forever
- Something wrong? We'll fix it or refund it
This product includes:


PNG
Transparent Background Image File
SVG
Editable Vector File for Web Use
JPG
High-resolution Image File
AI
Adobe Illustrator Source File
EPS
Editable Vector File for Print Use

Description: Bottleneck effect axis scheme on genetic drift and population outline diagram. Labeled graphic with time and species variation reduction after disaster event vector illustration. Nature change process
You may also like…
-

-

-

-
The change process steps and new beginning model adaption outline diagram
€9.67 Including Tax -

-

-

-
