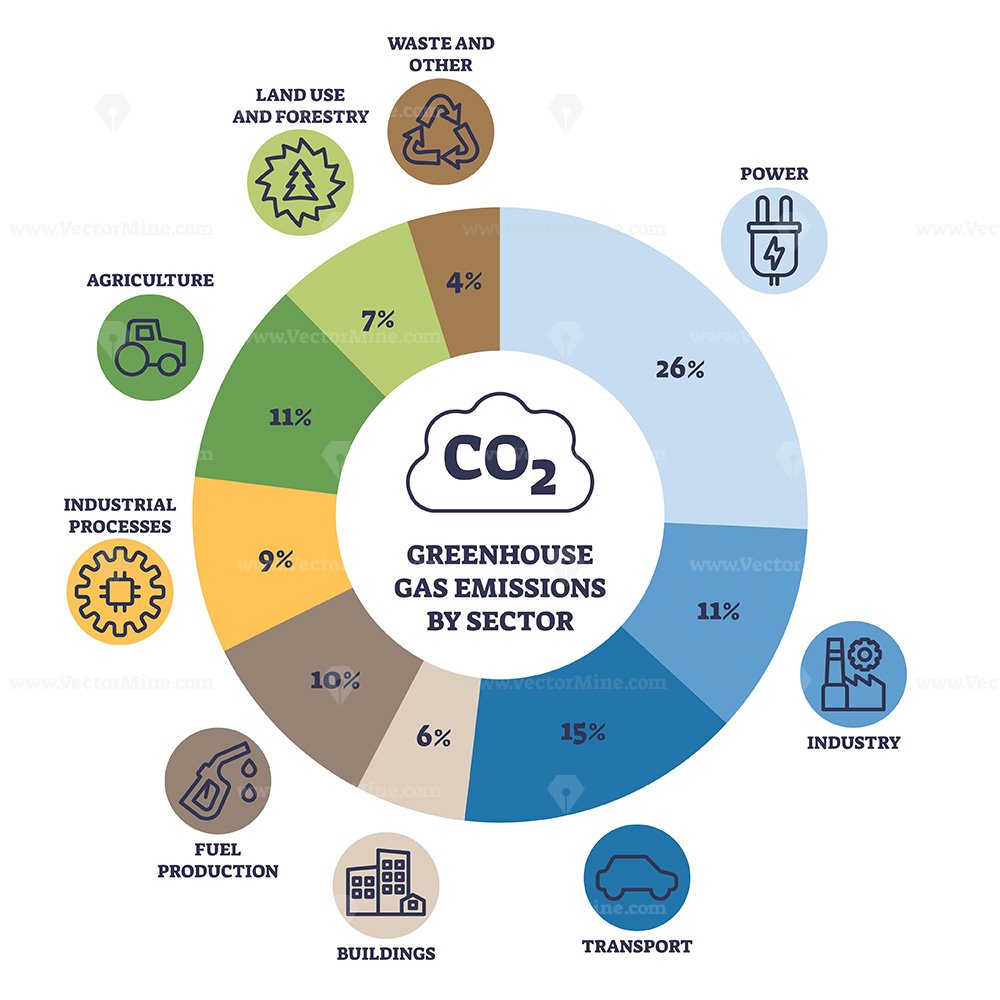
Greenhouse gas emissions by sector are illustrated with a circular chart highlighting power, industry, and transport. Outline style.
€7.99
This product includes:

1. Editable Vector .AI file
Compatibility:
Adobe Illustrator CC
Includes Editable Text Font SuezOne (Under Free Open Font License)

2. Editable Vector .EPS-10 file
Compatibility:
Most Vector Editing Software

3. High-resolution JPG image
4200 x 4200 px

License terms in short:
Use for everything except reselling item itself.
Read a full license here
Meta description: Greenhouse gas emissions by sector are illustrated with a circular chart highlighting power, industry, and transport. Outline style.


 Rhomboid muscles as skeletal muscular system for spine outline diagram
 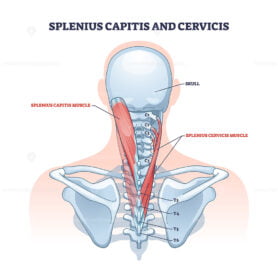 Splenius capitis and cervicis muscle location in human neck outline diagram
  FREE Agricultural marketing icons
  Mentalis muscle with chin buccinator and orbicularis parts outline diagram
  T-Cell activation diagram, vector scheme illustration
  Geniohyoid muscle with mylohyoid neck or chin muscular system outline diagram