
Oral microbiome balance diagram shows how hygiene and diet vs sugar and smoking tilt bacteria on a balance bar, shaping health, key objects, mouth, bacteria, tooth. Outline diagram
€7.99
This product includes:

1. Editable Vector .AI file
Compatibility:
Adobe Illustrator CC
Includes Editable Text Font SuezOne (Under Free Open Font License)

2. Editable Vector .EPS-10 file
Compatibility:
Most Vector Editing Software

3. High-resolution JPG image
4500 x 4114 px

License terms in short:
Use for everything except reselling item itself.
Read a full license here
Meta description: Oral microbiome balance diagram shows how hygiene and diet vs sugar and smoking tilt bacteria on a balance bar, shaping health, key objects, mouth, bacteria, tooth. Outline diagram


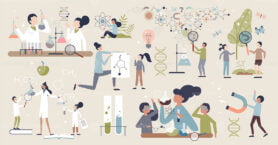 Kids science with physics and chemistry exploring tiny person collection set
  Halo effect as cognitive psychological personality bias tiny person concept
  Dehydration effects summarized in a brief diagram with mild, moderate, severe stages, shows a man figure, urine color chart, and symptom icons. Doodle style diagram
  Daily water intake guide in a brief diagram shows targets, benefits, and when to drink more, key items, glass of water, person, hydration icons. Doodle style diagram
  Dehydration effects overview, human silhouette, symptom icons, and arrows show mild to severe stages, explaining body water loss and warning signs like thirst and dizziness. Outline diagram
  Daily hydration intake guide explaining targets, benefits, and when to drink more, human silhouette, glass of water, and arrows summarize sources and math. Outline diagram
 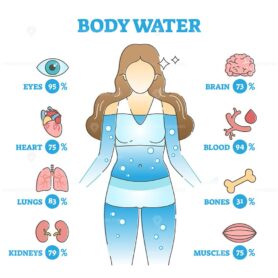 Body water as anatomical human organ fluid balance and usage outline diagram
 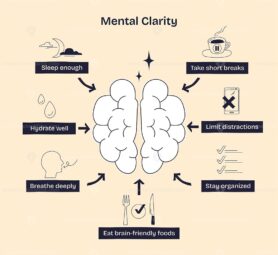 Mental clarity is shown by a brain with arrows pointing to habits like sleep, hydration, and limiting distractions. Doodle style diagram
  Hydration balance brief shows a split human silhouette comparing dehydration vs benefits, brain, kidneys, and skin highlighted with arrows for wellness. Outline diagram
  Food intake control vector diagram
  Vagus nerve activation diagram shows human outline, heart, and arrows to illustrate sympathetic vs parasympathetic response. Outline diagram
  Biofeedback loop shows how brain, heart, and sensors interact for self-regulation using signals and feedback. Outline diagram
  Psychophysiological process shows how a stimulus affects the brain, body, and is measured objectively. Key objects, brain, human body, monitor. Outline diagram