Showing 1–16 of 724 resultsSorted by latest
Showing 1–16 of 724 resultsSorted by latest


 Gut-brain axis visual explains two-way signaling between brain and intestines via the vagus nerve, affecting mood, memory, digestion, and immunity. Doodle style diagram
1 × €7.99
Gut-brain axis visual explains two-way signaling between brain and intestines via the vagus nerve, affecting mood, memory, digestion, and immunity. Doodle style diagram
1 × €7.99  Water purification process illustrated, raw intake to filtration, disinfection, and storage, with tanks, pipes, and filters guiding flow to homes. Outline diagram
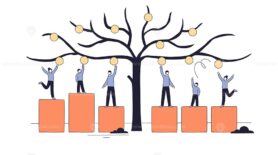
1 × €7.99 Flourish in aging illustrated tree shows holistic wellness exercise, learning, community centered on an active senior, key objects, running senior, branching tree, wellness icons. Outline diagram
1 × €7.99
Water purification process illustrated, raw intake to filtration, disinfection, and storage, with tanks, pipes, and filters guiding flow to homes. Outline diagram
1 × €7.99 Flourish in aging illustrated tree shows holistic wellness exercise, learning, community centered on an active senior, key objects, running senior, branching tree, wellness icons. Outline diagram
1 × €7.99  Gauge Levels V2 visuals depict performance tracking via colored meters, needles, and sliders, expressing status from low risk to optimal range. Outline style collection
1 × €4.99
Gauge Levels V2 visuals depict performance tracking via colored meters, needles, and sliders, expressing status from low risk to optimal range. Outline style collection
1 × €4.99  Hormone balance explained, a seesaw contrasts balance vs imbalance with estrogen, cortisol, and thyroid icons, showing mood, sleep, and cycle effects. Doodle style diagram
1 × €7.99
Hormone balance explained, a seesaw contrasts balance vs imbalance with estrogen, cortisol, and thyroid icons, showing mood, sleep, and cycle effects. Doodle style diagram
1 × €7.99  Linear vs circular economy comparison shows wasteful take-make-dispose vs closed-loop reuse. Arrows loop, recycling bins, factory illustrate flow and sustainability. Outline diagram
1 × €7.99 Food drive process flow showing donation, sorting, packing, and distribution, key objects include donation bins, arrows, and volunteers guiding steps for community aid. Outline diagram
1 × €7.99
Linear vs circular economy comparison shows wasteful take-make-dispose vs closed-loop reuse. Arrows loop, recycling bins, factory illustrate flow and sustainability. Outline diagram
1 × €7.99 Food drive process flow showing donation, sorting, packing, and distribution, key objects include donation bins, arrows, and volunteers guiding steps for community aid. Outline diagram
1 × €7.99 Subtotal: €52.93
| Cookie | Duration | Description |
|---|---|---|
| cookielawinfo-checkbox-analytics | 11 months | This cookie is set by GDPR Cookie Consent plugin. The cookie is used to store the user consent for the cookies in the category "Analytics". |
| cookielawinfo-checkbox-functional | 11 months | The cookie is set by GDPR cookie consent to record the user consent for the cookies in the category "Functional". |
| cookielawinfo-checkbox-necessary | 11 months | This cookie is set by GDPR Cookie Consent plugin. The cookies is used to store the user consent for the cookies in the category "Necessary". |
| cookielawinfo-checkbox-others | 11 months | This cookie is set by GDPR Cookie Consent plugin. The cookie is used to store the user consent for the cookies in the category "Other. |
| cookielawinfo-checkbox-performance | 11 months | This cookie is set by GDPR Cookie Consent plugin. The cookie is used to store the user consent for the cookies in the category "Performance". |
| viewed_cookie_policy | 11 months | The cookie is set by the GDPR Cookie Consent plugin and is used to store whether or not user has consented to the use of cookies. It does not store any personal data. |