Showing 33–48 of 629 resultsSorted by latest
Showing 33–48 of 629 resultsSorted by latest

 Lunar and solar tides diagram shows the sun, moon phases, and Earth influencing ocean tides. Key objects, Earth, Moon, Sun. Outline diagram
1 × €7.99
Lunar and solar tides diagram shows the sun, moon phases, and Earth influencing ocean tides. Key objects, Earth, Moon, Sun. Outline diagram
1 × €7.99  Major glute muscles with medius, maximus and minimus parts outline diagram
1 × €7.99
Major glute muscles with medius, maximus and minimus parts outline diagram
1 × €7.99  Pelvic floor therapy overview with anatomical diagrams, symptoms, and exercise illustrations. Key objects, pelvic anatomy, symptom icons, exercise poses. Outline diagram
1 × €7.99
Pelvic floor therapy overview with anatomical diagrams, symptoms, and exercise illustrations. Key objects, pelvic anatomy, symptom icons, exercise poses. Outline diagram
1 × €7.99  Iliacus muscle with hip or groin muscular, skeletal anatomy outline diagram
1 × €7.99
Iliacus muscle with hip or groin muscular, skeletal anatomy outline diagram
1 × €7.99  Homeostasis shows how the body maintains balance using a scale, thermometers, and brain icons to illustrate temperature regulation. Outline diagram
1 × €7.99
Homeostasis shows how the body maintains balance using a scale, thermometers, and brain icons to illustrate temperature regulation. Outline diagram
1 × €7.99  Sciatica pain is shown with highlighted nerve, pain areas, and spine structure, illustrating causes and affected regions. Outline diagram
1 × €7.99
Sciatica pain is shown with highlighted nerve, pain areas, and spine structure, illustrating causes and affected regions. Outline diagram
1 × €7.99 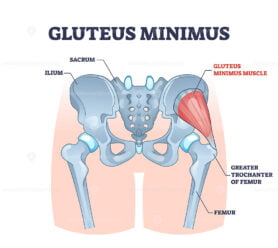 Gluteus minimus muscle with hips muscular system and bones outline concept
1 × €7.99
Gluteus minimus muscle with hips muscular system and bones outline concept
1 × €7.99  Alveolar gas exchange shows oxygen entering blood and carbon dioxide leaving via alveoli, capillaries, and red blood cells. Outline diagram
1 × €7.99
Alveolar gas exchange shows oxygen entering blood and carbon dioxide leaving via alveoli, capillaries, and red blood cells. Outline diagram
1 × €7.99  Horse muscles structure with detailed muscular system anatomy outline diagram
1 × €7.99
Horse muscles structure with detailed muscular system anatomy outline diagram
1 × €7.99  Oil and gas natural formation is shown stepwise from marine organisms to trapped resources and drilling, highlighting layers, pressure, and remains. Outline diagram
1 × €7.99
Oil and gas natural formation is shown stepwise from marine organisms to trapped resources and drilling, highlighting layers, pressure, and remains. Outline diagram
1 × €7.99  Direct and indirect sunlight diagram shows how sunlight hits Earth at different angles, highlighting the sun, Earth, and sunlight rays. Outline diagram
1 × €7.99
Direct and indirect sunlight diagram shows how sunlight hits Earth at different angles, highlighting the sun, Earth, and sunlight rays. Outline diagram
1 × €7.99 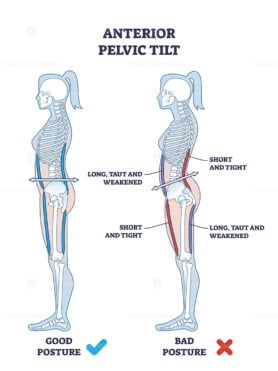 Anterior pelvic tilt or APT as pelvis abnormal posture outline diagram
1 × €7.99
Anterior pelvic tilt or APT as pelvis abnormal posture outline diagram
1 × €7.99  Gluteus maximus muscle as medical hip and leg medical anatomy outline diagram
1 × €7.99
Gluteus maximus muscle as medical hip and leg medical anatomy outline diagram
1 × €7.99  D-dimer test diagram shows blood vessel injury, clot formation, and breakdown with D-dimer fragments in blood. Outline diagram
1 × €7.99
D-dimer test diagram shows blood vessel injury, clot formation, and breakdown with D-dimer fragments in blood. Outline diagram
1 × €7.99  Heart rate variability (HRV) is shown with ECG lines, brain, and heart icons, illustrating high and low HRV states. Outline diagram
1 × €7.99
Heart rate variability (HRV) is shown with ECG lines, brain, and heart icons, illustrating high and low HRV states. Outline diagram
1 × €7.99  Traumatic brain injury is shown with a side-view head, brain impact zones, and labeled symptoms and causes. Outline diagram
1 × €7.99
Traumatic brain injury is shown with a side-view head, brain impact zones, and labeled symptoms and causes. Outline diagram
1 × €7.99  Orthostatic intolerance is shown with a person standing, blood flow changes, and symptom icons to illustrate effects of posture change. Outline diagram
1 × €7.99
Orthostatic intolerance is shown with a person standing, blood flow changes, and symptom icons to illustrate effects of posture change. Outline diagram
1 × €7.99  Stenos Laws explain rock layer formation, key objects, soil layers, faults, lava. Outline diagram
1 × €7.99
Stenos Laws explain rock layer formation, key objects, soil layers, faults, lava. Outline diagram
1 × €7.99  Plate boundaries diagram shows divergent, convergent, and transform faults with crust, mantle, and ocean features. Outline diagram
1 × €7.99
Plate boundaries diagram shows divergent, convergent, and transform faults with crust, mantle, and ocean features. Outline diagram
1 × €7.99  Earthquake mechanics shows tectonic plates, fault lines, and epicenter, illustrating seismic wave movement. Outline diagram
1 × €7.99
Earthquake mechanics shows tectonic plates, fault lines, and epicenter, illustrating seismic wave movement. Outline diagram
1 × €7.99  Formation of coal shows stages from swamp to coal with peat, sediment, and pressure layers. Outline diagram
1 × €7.99
Formation of coal shows stages from swamp to coal with peat, sediment, and pressure layers. Outline diagram
1 × €7.99  Glutes as gluteal body muscles for human buttocks strength outline diagram
1 × €7.99
Glutes as gluteal body muscles for human buttocks strength outline diagram
1 × €7.99  CO2 carbon dioxide emissions with hands capturing fossil gas outline concept
1 × €4.99
CO2 carbon dioxide emissions with hands capturing fossil gas outline concept
1 × €4.99  Cyclogenesis shows the formation of cyclones, highlighting cold and warm air fronts, wave patterns, and circulation. Outline diagram
1 × €7.99
Cyclogenesis shows the formation of cyclones, highlighting cold and warm air fronts, wave patterns, and circulation. Outline diagram
1 × €7.99  Electromagnetic Waves: Radioactive Gamma Rays Spectrum
1 × €7.99
Electromagnetic Waves: Radioactive Gamma Rays Spectrum
1 × €7.99  Low back pain diagram shows spine, herniated disc, spinal stenosis, and muscle strain with labeled anatomical structures. Outline diagram
1 × €7.99
Low back pain diagram shows spine, herniated disc, spinal stenosis, and muscle strain with labeled anatomical structures. Outline diagram
1 × €7.99  Clot busters work by dissolving blood clots in vessels, restoring blood flow, key objects, blood clot, drug, blood vessel. Outline diagram
1 × €7.99
Clot busters work by dissolving blood clots in vessels, restoring blood flow, key objects, blood clot, drug, blood vessel. Outline diagram
1 × €7.99  Atmosphere carbon exchange cycle in nature, planet earth ecology science vector illustration diagram scene with ocean, animals, plants and industrial factory
1 × €7.99
Atmosphere carbon exchange cycle in nature, planet earth ecology science vector illustration diagram scene with ocean, animals, plants and industrial factory
1 × €7.99  Summer vector illustration
1 × €4.99
Summer vector illustration
1 × €4.99  Heat pump vector illustration
1 × €7.99
Heat pump vector illustration
1 × €7.99 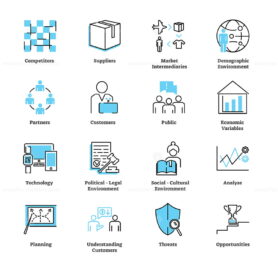 FREE Marketing environment icon collection set
1 × €0.00
FREE Marketing environment icon collection set
1 × €0.00  Osteoporosis diagram shows healthy vs osteoporotic spine and bone microstructure, highlighting vertebrae, fractures, and bone density loss. Outline diagram
1 × €7.99
Osteoporosis diagram shows healthy vs osteoporotic spine and bone microstructure, highlighting vertebrae, fractures, and bone density loss. Outline diagram
1 × €7.99  Global wind circulation patterns show the movement of air in Hadley, Ferrel, and Polar cells with arrows and jet streams. Outline diagram
1 × €7.99
Global wind circulation patterns show the movement of air in Hadley, Ferrel, and Polar cells with arrows and jet streams. Outline diagram
1 × €7.99  Rheumatoid arthritis diagram shows a comparison between healthy and affected joints, highlighting bone erosion, cartilage loss, and joint swelling. Outline diagram
1 × €7.99
Rheumatoid arthritis diagram shows a comparison between healthy and affected joints, highlighting bone erosion, cartilage loss, and joint swelling. Outline diagram
1 × €7.99  Dysautonomia overview showing differences in autonomic function with human figures, organs, and symptom icons. Outline diagram
1 × €7.99
Dysautonomia overview showing differences in autonomic function with human figures, organs, and symptom icons. Outline diagram
1 × €7.99  Atmospheric circulation diagram shows global wind patterns, Hadley cells, and pressure zones around Earth. Outline diagram
1 × €7.99
Atmospheric circulation diagram shows global wind patterns, Hadley cells, and pressure zones around Earth. Outline diagram
1 × €7.99  Vision of carbon harmony and CO2 pollution balance outline collection diagram
1 × €7.99
Vision of carbon harmony and CO2 pollution balance outline collection diagram
1 × €7.99  FREE Plants vector illustration icon collection set
1 × €0.00
FREE Plants vector illustration icon collection set
1 × €0.00  Diverse group engaging in playful activities, featuring people in wheelchairs and expressive gestures. Playful style
1 × €4.99
Diverse group engaging in playful activities, featuring people in wheelchairs and expressive gestures. Playful style
1 × €4.99 Subtotal: €311.58
| Cookie | Duration | Description |
|---|---|---|
| cookielawinfo-checkbox-analytics | 11 months | This cookie is set by GDPR Cookie Consent plugin. The cookie is used to store the user consent for the cookies in the category "Analytics". |
| cookielawinfo-checkbox-functional | 11 months | The cookie is set by GDPR cookie consent to record the user consent for the cookies in the category "Functional". |
| cookielawinfo-checkbox-necessary | 11 months | This cookie is set by GDPR Cookie Consent plugin. The cookies is used to store the user consent for the cookies in the category "Necessary". |
| cookielawinfo-checkbox-others | 11 months | This cookie is set by GDPR Cookie Consent plugin. The cookie is used to store the user consent for the cookies in the category "Other. |
| cookielawinfo-checkbox-performance | 11 months | This cookie is set by GDPR Cookie Consent plugin. The cookie is used to store the user consent for the cookies in the category "Performance". |
| viewed_cookie_policy | 11 months | The cookie is set by the GDPR Cookie Consent plugin and is used to store whether or not user has consented to the use of cookies. It does not store any personal data. |